Understanding the historical behavior of financial markets is one of the most important skills for any trader or investor. By studying past price movements and identifying repeating patterns, traders can anticipate possible future scenarios and improve their decision-making process. Fortunately, there are several tools designed to help analyze price history and market cycles in a professional way.
In this article, we will explore five powerful tools that can give you deeper insights into how markets evolve and how you can use that knowledge to your advantage.
1. TradingView – Interactive Charting and Historical Data
TradingView is one of the most popular platforms among traders due to its advanced charting features and accessibility. It allows you to:
- Access historical price data across different markets (stocks, forex, crypto, commodities).
- Use multiple timeframes, from 1-minute candles to monthly or yearly charts.
- Apply technical indicators like moving averages, RSI, or MACD to historical data.
What makes TradingView unique is its community. Traders around the world publish their analysis, which often includes cycle predictions and historical comparisons. This not only helps you validate your ideas but also exposes you to different trading perspectives.
2. MetaTrader 4/5 – Professional Backtesting
MetaTrader is widely known as a trading platform, but one of its most valuable features is backtesting. This tool allows traders to test strategies against historical price data to see how they would have performed in the past.
Key benefits include:
- Running simulations with indicators or automated trading systems (Expert Advisors).
- Identifying which strategies are more effective during specific market cycles.
- Understanding how volatility, spreads, and execution time affect performance.
For traders who want to confirm whether a system works consistently across different historical periods, MetaTrader is an essential tool.
3. CoinMarketCap / CoinGecko – Historical Data for Cryptocurrencies
When it comes to cryptocurrencies, two of the most trusted resources are CoinMarketCap and CoinGecko. These platforms provide:
- Historical price charts for thousands of cryptocurrencies.
- Data on market capitalization, trading volume, and supply over time.
- Tools to compare performance between different tokens.
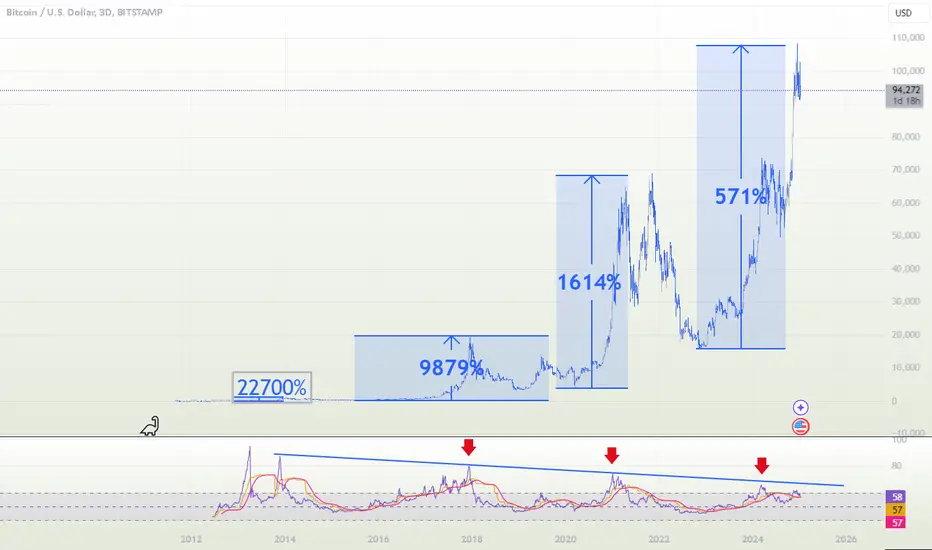
Studying the historical charts of Bitcoin, Ethereum, or altcoins allows traders to identify cycles such as bull runs, corrections, and accumulation phases. This is particularly important in the crypto world, where cycles tend to be shorter and more volatile compared to traditional markets.
“Historical Bitcoin Price Cycles: Recognizing Bull and Bear Phases Over Time”
4. Google Trends – Market Sentiment Through Time
While not a traditional charting platform, Google Trends is extremely useful for analyzing market sentiment throughout different cycles. It shows how frequently certain keywords are searched on Google over time.
For example:
- A spike in searches for “buy Bitcoin” often coincides with increased retail interest during a bull cycle.
- Declines in searches can signal fading hype, often aligning with bear markets or sideways consolidation.
By comparing Google Trends data with historical price charts, traders can see how market sentiment influences cycles. This can be especially helpful when trying to anticipate turning points in the market.
5. On-Chain Analysis Tools (Glassnode, IntoTheBlock)
For cryptocurrency traders, on-chain analysis platforms like Glassnode or IntoTheBlock provide a unique perspective on cycles that goes beyond price charts. These tools analyze blockchain data directly, giving insights such as:
- Wallet activity (how many addresses are buying, selling, or holding).
- Exchange inflows and outflows, which often predict buying or selling pressure.
- Long-term holder behavior, helping to identify accumulation vs. distribution phases.
For example, when long-term holders start selling after years of accumulation, it often signals the beginning of a market top. On the other hand, when wallets increase their holdings during a downturn, it may mark the beginning of a new accumulation cycle.
Conclusion
Analyzing historical prices and market cycles is not about predicting the future with certainty, but about recognizing patterns that tend to repeat. By using tools like TradingView, MetaTrader, CoinMarketCap/CoinGecko, Google Trends, and on-chain analysis platforms, traders can combine technical data, sentiment, and blockchain metrics to build a more complete picture of the market.
The key is to use these tools consistently, compare findings, and always remember that history may not repeat itself exactly, but it often rhymes. With the right analysis, you can increase your chances of making smarter trading decisions and staying ahead of market cycles.